Bitcoin 2016: Looking for Reversals

Bitcoin 2016: Predicting Bitcoin Reversals
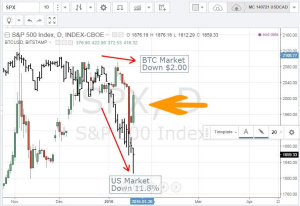
Markets in 2016 have gotten off to a horror start with the US market (S&P500) down 11.8% (to closing price Jan 20, 2016) = the black bars on the chart. This has been matched with drops in other markets – some larger and some smaller.
- Europe 15%
- Japan 18%
- China 22%
- Emerging Markets 16%
Bitcoin was doing the same and at the end of January 15 had dropped 19% = the red and green bars on the chart. By the end of trade on January 20, BTC had recovered almost all the year’s losses. Was it possible to predict the reversal?
In the last video in this Bitcoin Markets series, (on the day of BTC’s big drop) I reviewed Bitcoin from a technical analysis point of view. My view was that I would be a buyer of Bitcoin from a technical viewpoint if I could see clear signs of reversal. In this next video, I go through what clear signs of reversal means and I also lay out a bunch of reasons not to take a trade.
Enjoy the video
Note: this analysis is based entirely on the analysis of price data from a technical point of view – i.e., where are the buyers and where are the sellers. This is a completely different process to analysing a market from a fundamental point of view – i.e., will there be enough demand for current and future supply.


