Bitcoin Trading 2016: What Next After Triangle?
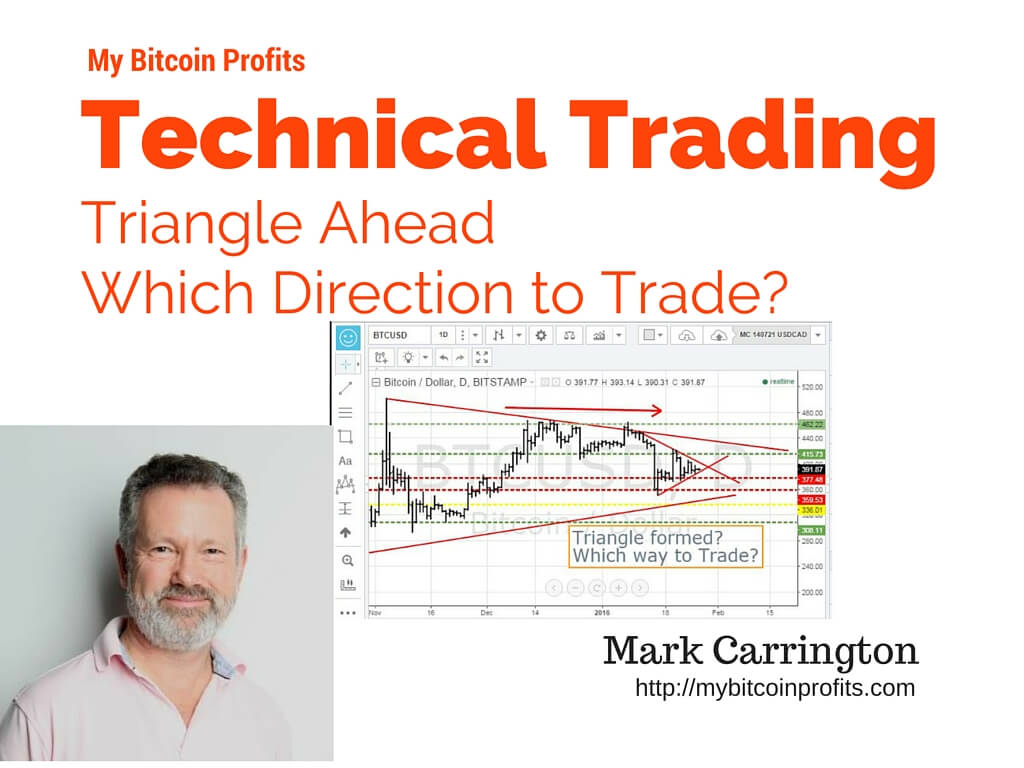
Bitcoin Trading Indecision
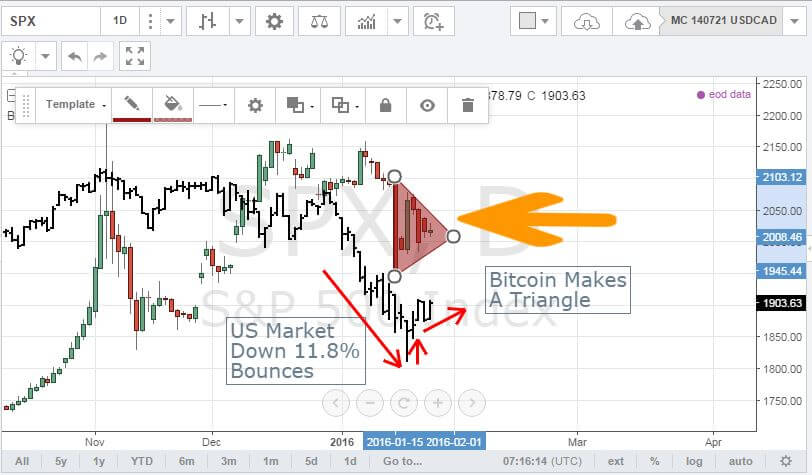
The horror start to 2016 markets had to come to an end. After an 11.8% drop in the US market (S&P 500) – and a lot worse in other markets – there had to be a bounce. Oil prices took a day off from falling and the stock markets took a step upwards. This played out differently in the stock markets and the Bitcoin trading market.
As you can see in the chart below the S&P 500 opened on January 20 at a level, dropped hard and then recovered with the closing price in the top half of the bar (look for the red vertical arrow on the chart) – we call this a Low Test Bar. The next two days we see price making higher highs and then 3 days sideways. Bitcoin behaved differently – it bounced much more firmly than the stock market and then the next days tracked down again almost as if it had gone too far. This has created a triangle of lower highs and higher lows.
In this video, I work through how to look at that situation from a trading point of view. I also introduce some pattern ideas which I have not discussed in earlier videos. Listen out for Double Top and for Head and Shoulders – sounds like a hairdressing salon.
Note: this analysis is based on technical factors.
It pays to think about fundamental questions as well. What’s happening to US Dollar? What is happening in China? How does what is happening in China affect the Chinese currency (Chinese Yuan and Remnimbi – they have an offshore and an onshore currency)? Will China affect Bitcoin pricing given that there are huge holdings of Bitcoin in China?


